
In the EU, according to the web pages dedicated to waste, we currently use 16 tonnes of material per person per year, of which 6 tonnes become waste. In 2012, total waste amounted to 2.5 billion tonnes and only a limited share of this total was recycled. The rest was landfilled or burned, of which some 600 million tonnes could be recycled or reused. Indeed, despite the ongoing improvements, the European economy continues to lose a significant amount of potential “secondary raw materials” present in the waste streams, such as metals, wood, glass, paper, plastics, organic matter and inert materials.
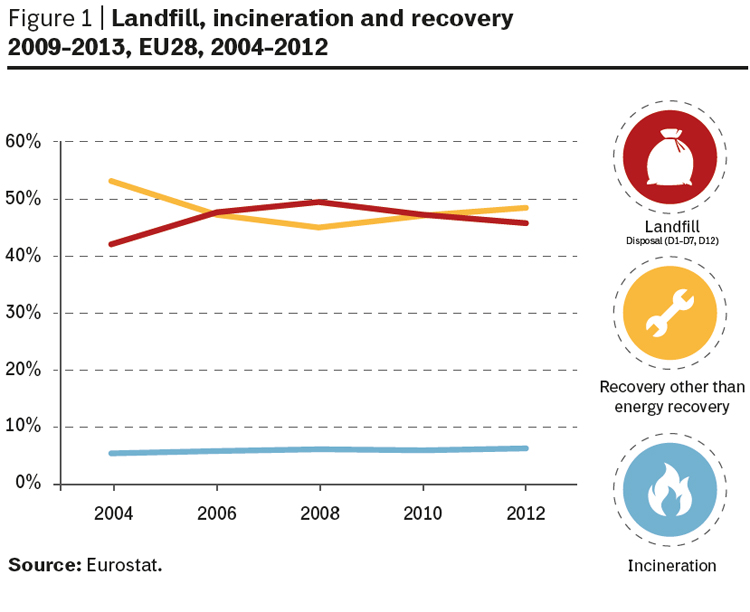
Despite acknowledging the unsatisfactory situation, policies do not seem to follow at the right pace. Indeed, figures confirm a trend that ZeroWasteEurope defines as “worrying”: recycling continues to stagnate. Official Eurostat data (see figure 1) show that landfilling and disposal into water bodies have increased since 2008, overtaking even recovery in 2012, while incineration is stable. This clearly is not the wisest approach to deal with the flows of products at the end of their life cycle.
EPR Systems: Streams Under Control
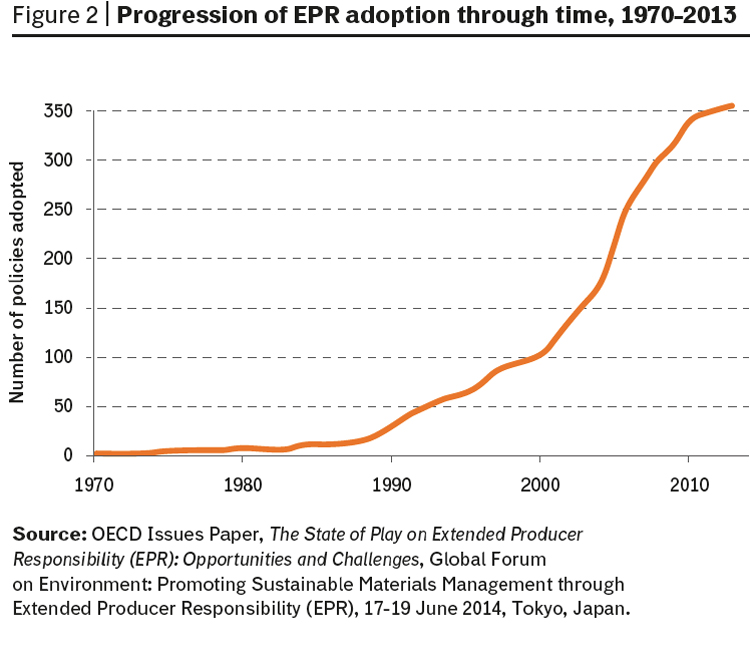
One of the policy concepts that can help closing the waste-resources loop and that is increasingly being used around the world – as can be seen in figure 2 – is Extended Producer Responsibility (EPR). EPR as a policy stems from the polluter-pays principle, which is a pillar of EU environmental policy. It is defined in the 2001 OECD Guidance as “an environmental policy approach in which a producer’s responsibility for a product is extended to the post-consumer stage of a product’s life cycle.” There are several types of EPR policies, the most widespread being take-back, Advance Disposal Fees (ADF) and deposit/refund schemes. Very often, the obligations set in legislation, or the targets set voluntarily by the producers themselves, are pursued through waste-stream-specific Producer Responsibility Organisation. When not exclusive, these operate in competition; self-compliance by the individual producers is usually a viable option as well.
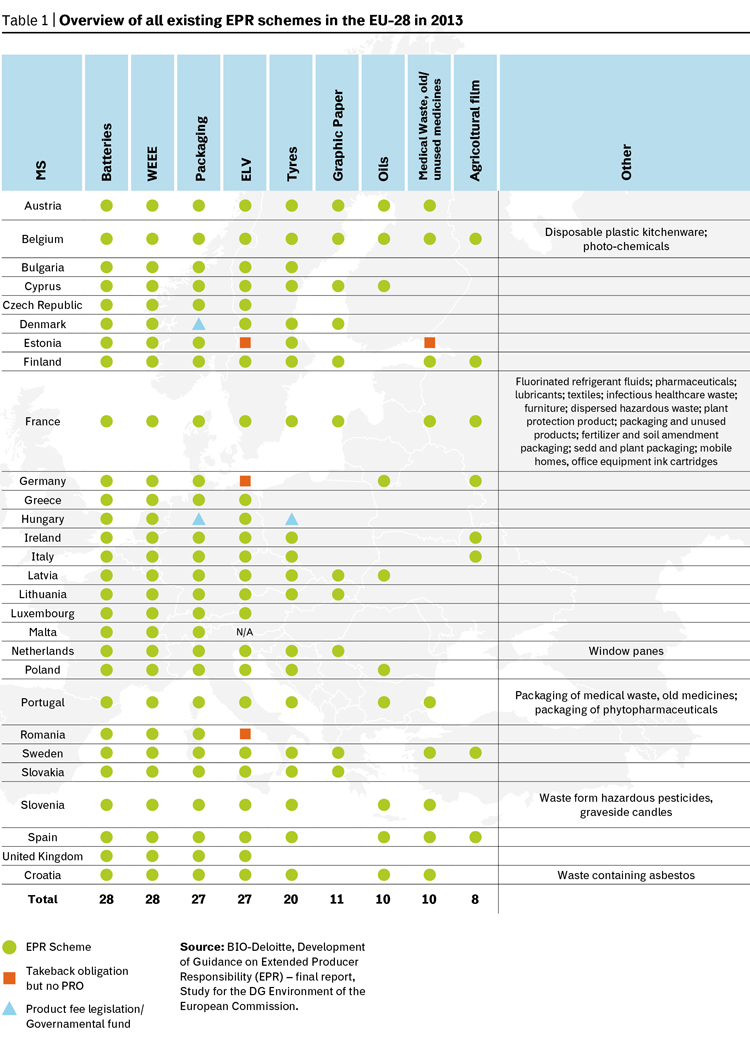
EPR as a policy approach in the EU is adopted in the End of Life Vehicles (ELV) Directive of 2000, in the Waste of Electric and Electronic Equipment (WEEE) Directive of 2012 and in the Batteries Directive of 2006. EPR is widely used in EU Packaging and Packaging Waste policy (1994 Directive). Finally, the Waste Framework Directive of 2008 sets some principles for the implementation of EPR. And indeed, in many member states, EPR policies or voluntary agreements have been put in place for products not covered by EU legislation, as can be seen in table 1.
Key aspects to consider for assessing how successfully these policies are implemented concern the technical performance (quantities put on the market, waste generated, collection and treatment, steering of innovation towards enhanced recyclability) – which is represented through:
- collection (CR – ratio of collected quantities to quantities put on the market);
- recycling rates (RR – % of recycled materials on collected waste);
- economic performance (costs, their coverage, etc.).
Here, we will concentrate on the technical aspect. Let us see what data and statistical analysis tell about materials covered by EU or national policies.
Different Performances in Different Countries
A recent study funded by the European Commission to examine waste management systems in sixteen EU member states (MS) found that official Eurostat data on waste streams, collection and recycling are not that reliable: “Even after extensive investigation, there is a severe lack of comparable information available for economic and technical performance.” In order to overcome the inconsistencies, the authors carried out an in-depth study of 36 cases (specific waste streams in particular countries), including the four products covered by EU legal acts (ELV, WEEE, batteries, packaging), plus two others for which EPR schemes are present in several European states (graphic paper and oils).
The evidence thus collected is sufficient for the authors to argue in favour of strengthening EPR policies, as these led to “undeniable improvements in waste recycling and recovery performances in all MS.” However, they confirm that technical performances are highly variable throughout Europe.
- Batteries (about 1.7 million tonnes of waste produced): In the analysed cases, portable batteries CR ranges from 36% (France) to 72% (Switzerland). These figures are higher than the EU target for 2012 (25%) and in most cases also beyond the target for 2016 (45%). As for industrial and automotive batteries, having market value, in all cases CR is near 100%. According to Eurostat data, however, in Malta it is as low as 5%.
- ELV waste – 9 million tonnes – shows high recycling rates in all studied countries, between 83% (Finland, Netherlands) and 92% (Germany), all near or beyond the ELV directive targets for 2015 (85%). Eurostat data give an average recycling of materials from light vehicles varying from 64% in Malta to 96% in Germany.
- Paper (47 million tonnes of waste produced): a much more mixed picture emerges, recycling rates vary greatly: from 43% (France) to 87% (Finland) and 94% (Sweden). The gap would mostly be explained by the higher market value of collected waste paper in Scandinavian countries. No data are provided by Eurostat for recycling of this waste stream.
- Most EPR schemes for used oils – about 5.2 million tonnes – cover exclusively mineral-based lubricant (industrial, non-edible) oils. The quantities collected vary significantly: from 2.7 kg/cap./year (Portugal) to 5.6 kg/cap./year (Germany). Regeneration rates range between 69% (Spain) and 91% (Belgium). The Italian scheme is said to achieve fairly high regeneration rates (around 89%) but to be much more expensive for producers. Also for this waste stream, no Eurostat data on recycling are available.
- The studied EPR schemes for packaging waste – 80 million tonnes – have different scopes: in some MS, they cover only household packaging waste, whereas in other countries it also covers commercial and industrial packaging. For the fractions covered, however, they all achieve the recycling targets set by the corresponding Directive in all the studied cases, among which the lowest in the UK (all packaging, 61%) and the highest in Belgium (household packaging, 85%). Eurostat data tell packaging CRs go from 47.5% in Malta to 97% in Belgium.
- WEEE (approximately 7.5 million tonnes in 2012): recycling rates across the studied countries are fairly homogeneous. All schemes achieve the targets set by the WEEE Directive. High discrepancies arise with regards to the collected quantities: they range from 2.0 kg/cap./year (Latvia) to 17.5 kg/cap./year (Sweden). According to Eurostat, WEEE CRs vary from 1.2 kg/cap. (BG) to 17.2 kg/cap (BE), the average being 6.6 kg/cap.
As general conclusions, the study highlights that the best performing schemes are not, in most cases, the most expensive, that the fees paid by the producers vary greatly for all product categories and that no single EPR model emerges as the best performing and the most cost-effective. Each material stream has its own characteristics, and local conditions greatly influence the efficiency of EPR schemes. All that can be said is that, on average, where such schemes are in place, the European waste management hierarchy is complied with better than where the market does not have a specific institutional framework and is left to auto-organisation. The latter often leads to the same results, but it is often required for the right solutions to emerge and there is still plenty of room for free-riding and cheating.
Interesting conclusions are also drawn by other in-depth studies, investigating the functioning of EPR schemes in the context of various non-European OECD countries, such as e.g. of Japan’s WEEE Recycling Act (Tasaki et al., 2007), finding that collection of manufactured goods have enjoyed mixed success (due to illegal disposal and exports), but the recycling of collected goods has performed well. The most interesting results of the enforcement of comprehensive recycling laws in Japan are in the advance of innovation in environmental technologies, and these contributed to an increased level of recycling. A statistical study on U.S. households’ attitude towards plastic water bottle deposit/refund (Viscusi et al., 2011), concludes that “for the population at large, a fascinating transformation in behaviour occurs with the introduction of incentives to recycle,” since “the change in the recycling rate exhibits a jump as people shift from being nonrecyclers to diligent recyclers.” Also Batson and Eggert (2012) find that in the U.S. there is a substantial difference in recycling rates between states without a deposit/refund (roughly 30%) and those with a deposit/refund (roughly 70%), regardless of the deposit rate. Kaffine and O’Reilly (2015) carried out, on behalf of the OECD, a wide review of similar empirical studies, finding that:
- policies such as deposit/refund are likely to be more efficient than advanced disposal fee;
- collective PROs may be attractive as they take advantage of economies of scale and reduce the need to monitor individual firms, but care should be taken that market power is not exploited;
- EPR policies provide an implicit incentive in favour of “products’ design for the environment,” although policies that directly target product characteristics (weight, recyclability, etc.) are more effective;
- EPR policies can achieve their environmental goals, but the open question is which policies are economically more efficient (lowest costs).
Also country-specific conditions and local factor – including cultural and behavioural ones – have a great influence on performance, as the great discrepancies in CRs and RRs between countries that have similar schemes show.
One important general conclusion that can be drawn from the empirical studies on EPR scheme, which is worth underlying here, is that the presence of compliance schemes raise the ability of the countries where they are in place to achieve collection and recycling targets. Kaffine and O’Reilly label this ability “Environmental effectiveness of EPR,” and state that “the general consensus in the academic and non-academic economic literature is that mandates such as take-back requirements and recycling content standards do increase the amount of material recycled and the recycling rate.”
An important feature investigated in the literature concerns the quality of materials collected. Here the evidence is scarcer and definitely not conclusive. E.g. Acuff (2013) finds that while collection methods, like single stream recycling, have positive aspects such as increased diversion rates (more material sent from households to recycling centres), they also increase contamination rates and the amount of residual material ultimately diverted to landfills by the recycling centres. An issue paper by the International Solid Waste Association (ISWA, 2014) provides further references to relevant studies and highlights other aspects to which attention should be paid in designing EPR compliance schemes.
Outside EPR, Streams are Hardly Studied
Waste streams that are not (yet?) widely targeted by EPR policies are, unfortunately, not very much studied in this context, although the studies often aim at clarifying why and how new compliance schemes should be set up. Biomasses are a case in point.
In the EU-28, 1.7 tonnes of biomasses are collected each year and a further 0.7 million tonnes of biomass is derived from such production as waste by-product. In addition, 0.17 billion tonnes are imported, including exclusively or mainly biomass and a little less than 0.15 billion tonnes are exported. Overall, biomasses, including cutting, harvesting and cultivation by-products that each year are turned into waste, EU’s waste water or emissions amount to approximately 2.4 billion tonnes.
Another one is construction and demolition (C&D) waste. While the waste framework directive provides for a target of reuse, for this kind of waste, recycling and other forms of material recovery of 70% by 2020, it does not envisage specific instruments. C&D waste is also usually not addressed in national EPR policies, as member states are still in the process of integrating the European target into national legislation. In 2012, according to a report for the DG Environment (IEEP, BIO et al., 2012), EPR schemes were in place (in some cases as voluntary producers’ initiative) in Austria, Ireland, Germany, Malta, Spain and the UK; and since then, some more may have been created, whose effects would not alter the analysis of the latest available data. The bad news is, however, that there are many other reasons why data should be handled with care, knowing that any possible conclusion should require confirmation.
C&D waste includes many different materials. This implies that the concept of “quantities put on the market” becomes difficult to apply to C&D material streams. In principle, quantities put on the market should be calculated by broad product categories, i.e. for groups of products used in construction determined according to the materials they are made of. Moreover, the life cycle of C&D materials being much longer than a year, the concept of collection rate loses some of its usefulness, as C&D waste produced (maximum limit for C&D collected) in a given year may come only for a minor fraction from materials used in construction activities in the same year.
Let us therefore concentrate on a fraction of C&D waste, namely to that of mineral waste, excluding metallic minerals. Their amount can be compared to that of the apparent consumption of minerals (and deriving products) used in construction.
Eurostat data (see table 2) on C&D waste provide an interesting starting point. However, it must be pointed out that on some occasions data comparison seems rather arbitrary: as mentioned before, at row level, data suffer from imperfections affecting comparability and at column level, because national mineral consumption accounts for mineral raw materials extracted from the domestic market, instead of the domestic manufacturing of products derived from them. But, since it adds product imports and subtracts exports, these data can be considered an acceptable approximation of quantities placed on the market.
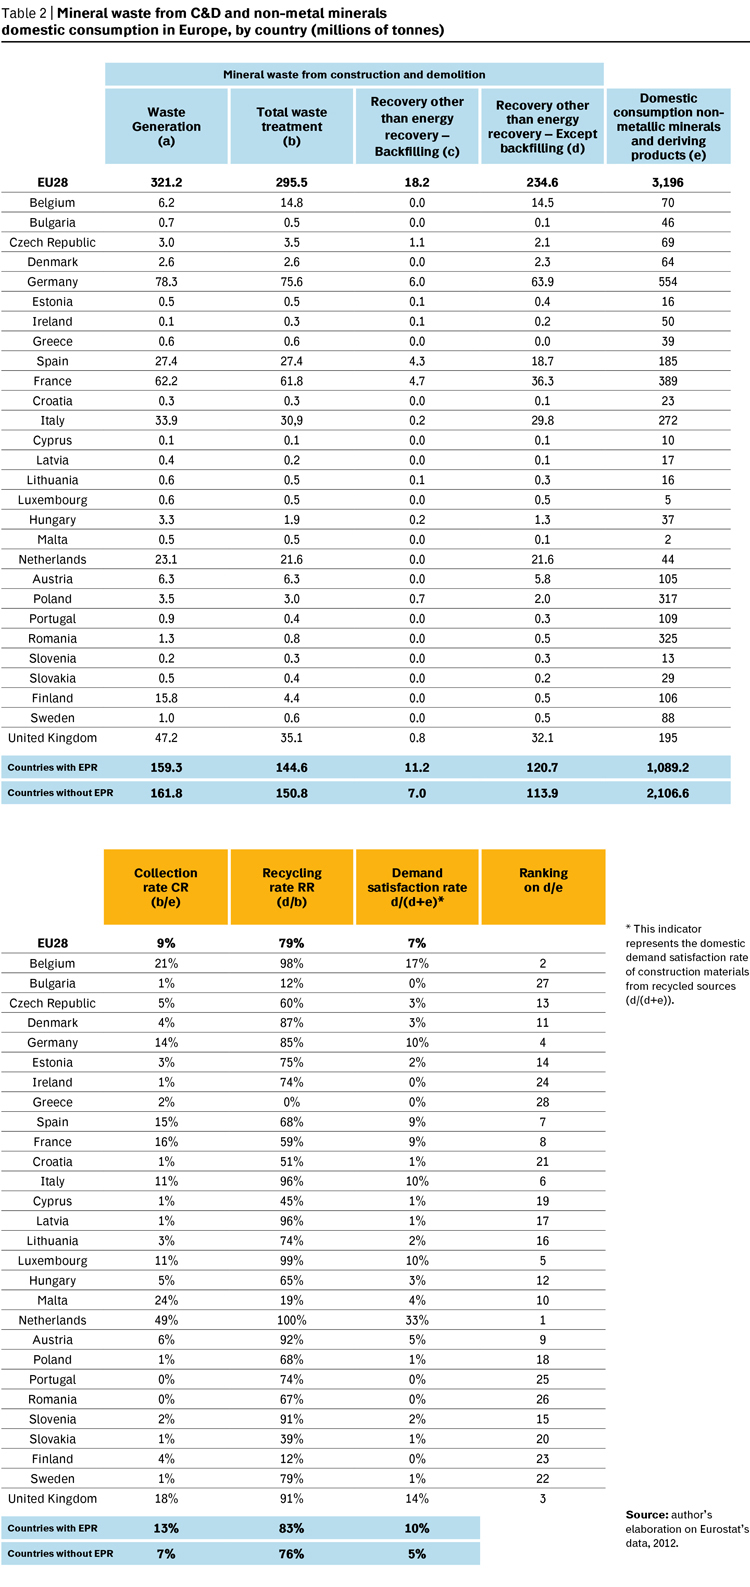
In the suggested table, next to indicators equal to collection (b/e) and recycling rates, we included a particularly significant indicator, “the satisfaction rate of domestic demand for construction materials from recycled sources (d/d+e). As it appears, only one of the 19 countries not reaching 5% of such indicator is amongst the 6 claiming to have EPR systems in place. This is Malta, whose EPR system we were not able to verify through operational data; nor does it seem to deal with waste one of the 6 authorized C&D authorized collection systems, listed on the Malta Environment and Planning Authority web page.
In the bottom part of the table the average indicators of countries with a compliance scheme have been calculated, comparing them with indicators of those without them. The better performance of the former is mainly due to the higher ratio between treated waste and quantity of minerals placed on the market (columns b/e), rather than to high recycling rates (column b/d).
Within the limited significance of data regarding the effects of compliance schemes, the evidence is positive. Admittedly, it is only an indication, but something nonetheless.
EU web pages devoted to waste: ec.europa.eu/environment/waste/.
Bibliography
- Acuff K. L., Cashing in on trash: Internalizing the external benefits from recycling – PhD Dissertation, Colorado School of Mines, 2013 (phdtree.org//pdf/23462766-cashing-in-on-trash-internalizing-the-external-benefits-from-recycling/).
- BIO-Deloitte, Development of Guidance on Extended Producer Responsibility (EPR) – final report, Study for the DG Environment of the European Commission, 2014 (ec.europa.eu/environment/waste/pdf/target_review/Guidance%20on%20EPR%20-%20Final%20Report.pdf).
- BIO-Deloitte, Review of the Producer Responsibility Initiative model in Ireland – Working paper on European PRIs, study for the Government of Ireland, 2014 (www.environ.ie/en/Publications/Environment/Waste/WasteManagement/FileDownLoad,38367,en.pdf).
- BIO-Deloitte, Screening template for Construction and Demolition Waste management in Italy, Ongoing study for the European Commission, 2015 (ec.europa.eu/environment/waste/studies/deliverables/CDW_Italy_Factsheet_Final.pdf).
- European Commission, webpages on waste (ec.europa.eu/environment/waste), Eurostat database (ec.europa.eu/eurostat/data/database), 2015.
- European Environment Agency – European Topic Centre on Resource and Waste Management, EU as a Recycling Society – Present recycling levels of Municipal Waste and Construction & Demolition Waste in the EU, 2009 (scp.eionet.europa.eu/publications/wp2009_2/wp/WP2009_2).
- Government of Malta – Ministry for sustainable development, the environment and climate change, Waste Management Plan For The Maltese Islands – A Resource Management Approach 2013-2020 (gov.mt/en/Government/Press Releases/Documents/PR2346a_Waste Management Plan 2013 – 2020 - Consultation Document October 2013.pdf).
- Kaffine D., P. O’Reilly, What have we learned about extended producer responsibility in the past decade? A survey of the recent EPR economic literature, OECD document ENV/EPOC/WPRPW(2013)7/FINAL, 2015.
- IEEP, BIO et al. (2012), Use of economic instruments and waste management performance, DG Environment – Study for the DG Environment of the European Commission, 2012 (ec.europa.eu/environment/waste/pdf/final_report_10042012.pdf ).
- ISWA – International Solid Waste Association, Issue Paper on Extended Producer Responsibility, 2014 (www.iswa.org/index.php?eID=tx_iswaknowledgebase_download&documentUid=4202).
- Malta Environment and Planning Authority (www.mepa.org.mt/wastemanagementfacilities).
- Perchards-SagisEPR, The collection of waste portable batteries in Europe in view of the achievability of the collection targets set by Batteries Directive 2006/66/EC – Study on behalf of the European Portable Battery Association (EPBA), 2013 (www.epbaeurope.net/documents/Perchards_Sagis-EPBA_collection_target_report_-_Final.pdf).
- Tasaki T., A. Terazono, Y. Moriguchi, An Evaluation of the First Five Years After Enactment of the Japanese Wee Recycling Act and the Current State, Proceeding Sardinia 2007, 11, International Waste Management and Landfill Symposium, 2007 (drive.google.com/file/d/0B0LFEkPytiOcaEtRaHZabERyWmM/view?pli=1).
- Viscusi, W. K., J. Huber, J. Bell, “Alternative Policies to Increase Recycling of Plastic Water Bottles in the United States,” Review of Environmental Economics and Policy, volume 6, issue 2, summer 2012, pp. 190-211 (reep.oxfordjournals.org/).